How to Export Data Using MOSES
Export data is a new function in MOSES to allow users exporting data from MOSES using user defined criteria. To export data, select the data you want to export from main menu Reports > Export Data >Export Sales Data.
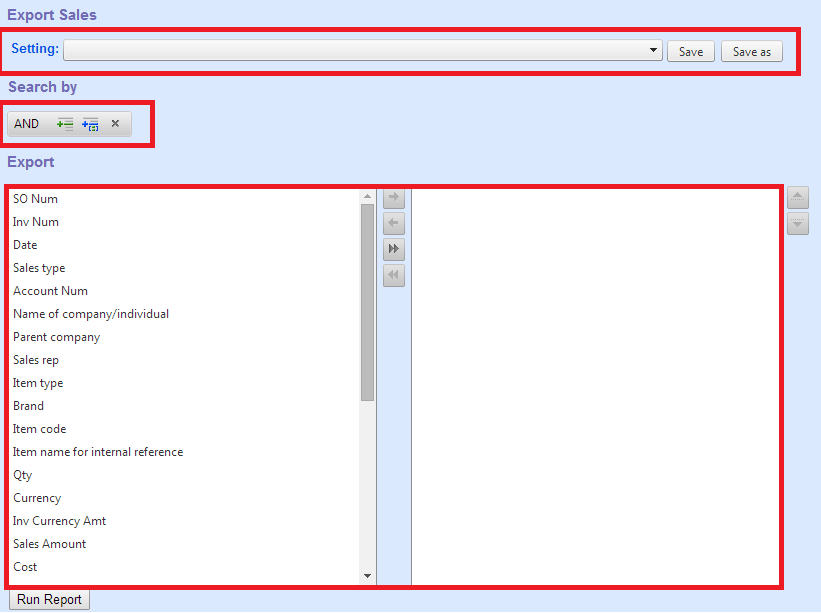
- Settings
User can save report setting or retrieve saved setting.
- Search Criteria
User can create filter criteria to tailor made his/her reports.
- Output Columns
User selects the columns which need to be exported to build his/her report.
Now we illustrate how to create a sales report with the following criteria and output columns.
Criteria:
1. Sales date between “2014/01/01 and 2014/04/30”
2. Customer equal to “090028-walk in”
Output columns:
1. Invoice date
2. Invoice number
3. Item code
4. Qty
5. sales amount
6. Profit
Step:
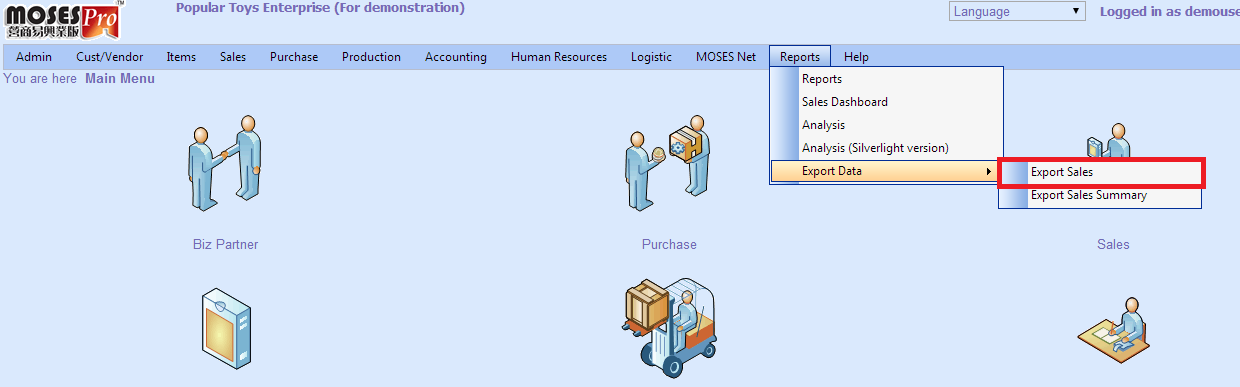
1. Sign in the MOSES system account. From the top of page, click
Reports> Export Data>Export Sales.
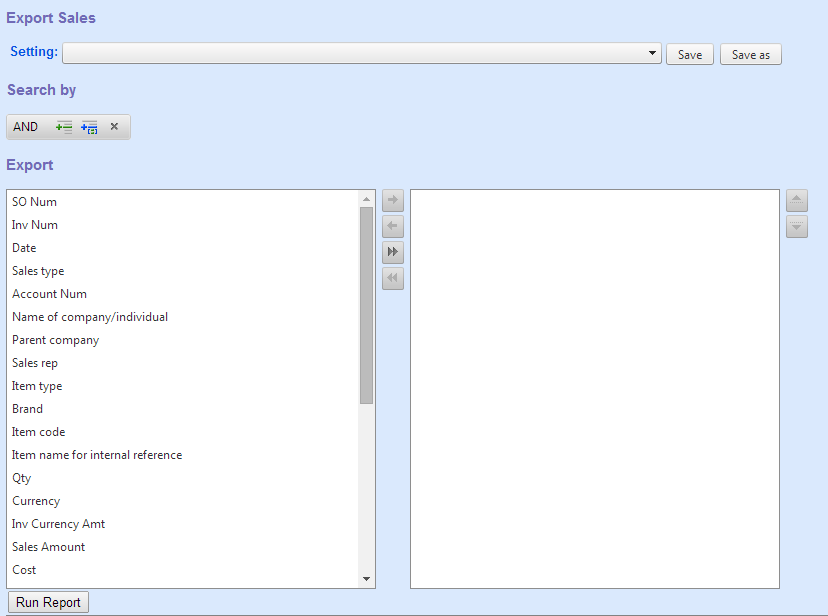
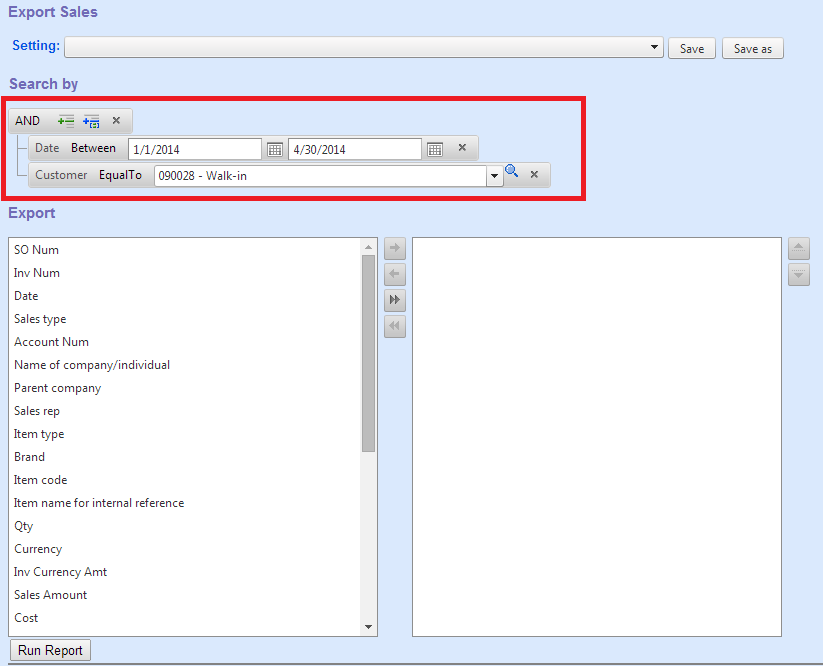
2. Next, you will see the custom sales report layout as follow.
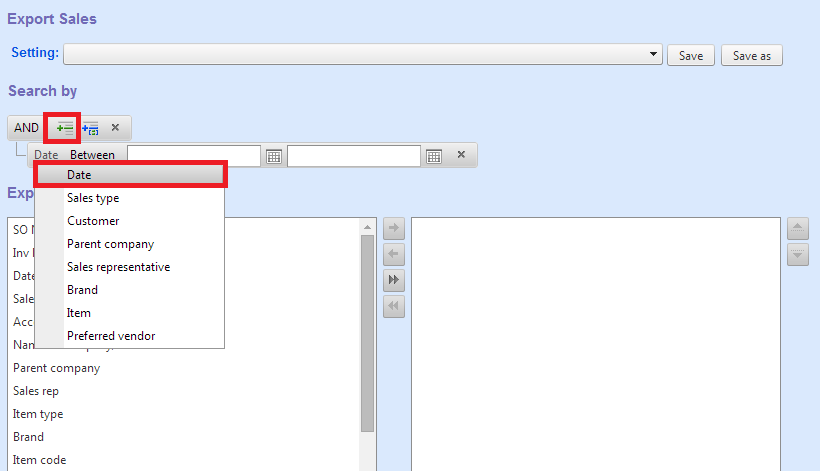
 3. Based on the two criteria, click “
 ” button, select “Date” tab to add the first criteria.
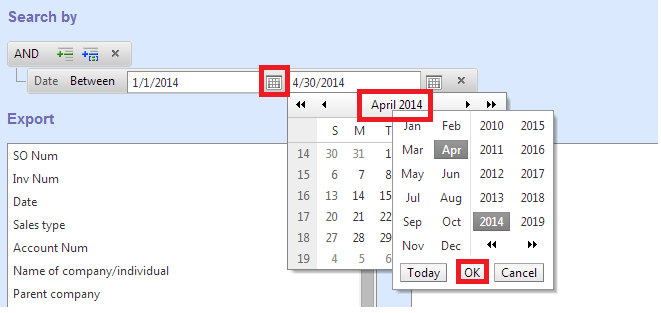
 4. Click “
 ”button, you will see the calendar, select the date as you need. In this example, we select the date from 2014/01/01 to 2014/04/30.
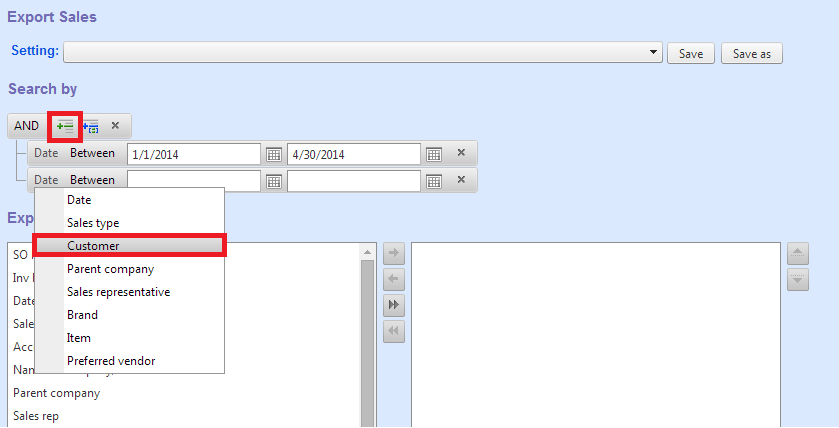
 5. Next, add the second criteria. Click “” button, select “Customer” tab.
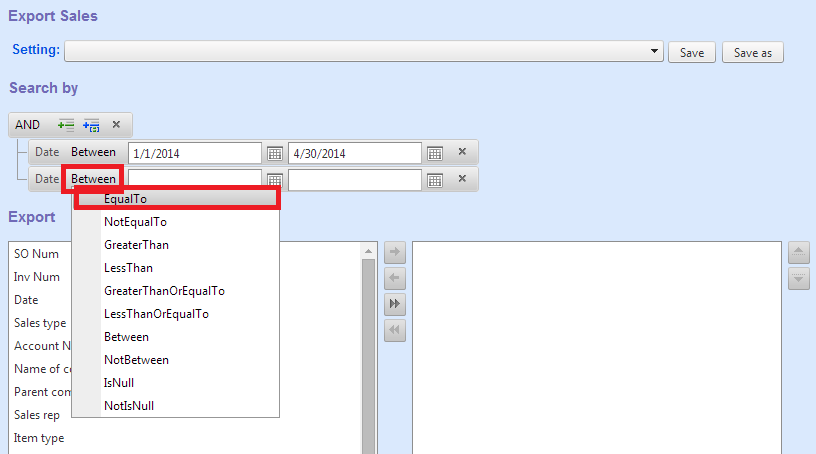
6. Click “Between” tab, select “Equal to”.
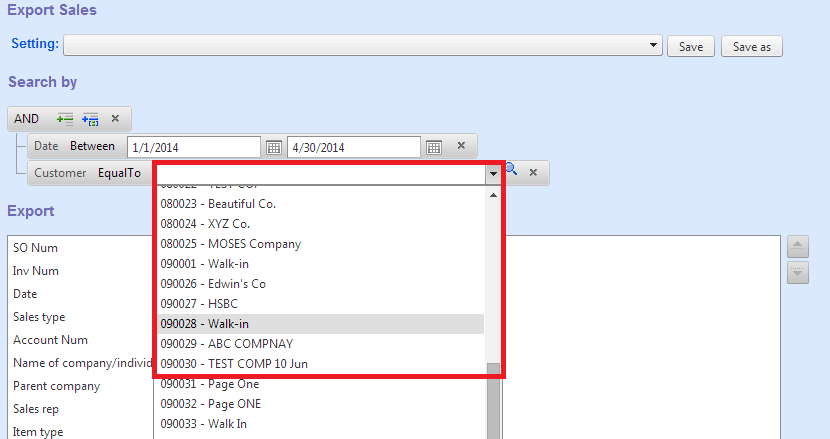
7. Select the second criteria from the listed box.
8. Finish selecting criteria operation.
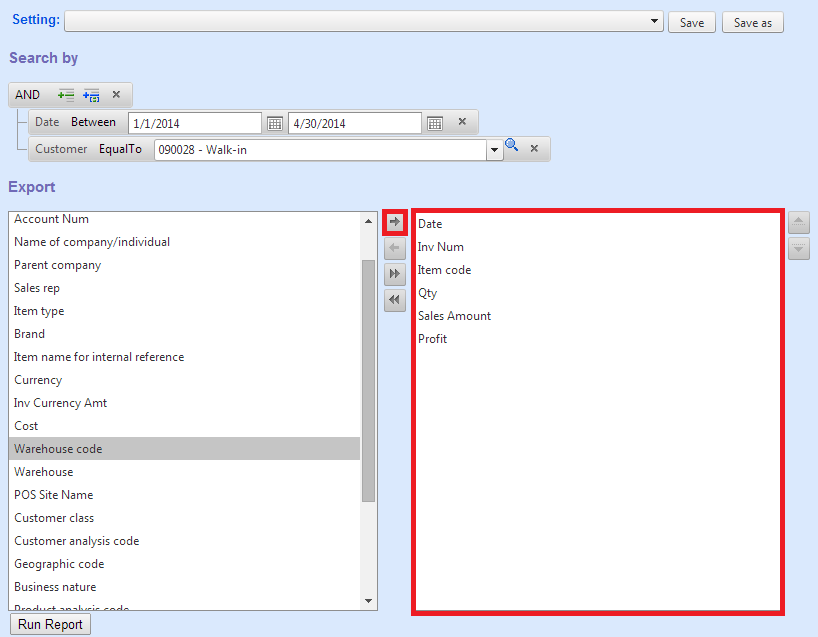
9. Next, Select the export columns from the left-hand side list box, click “ ”button to add output columns.
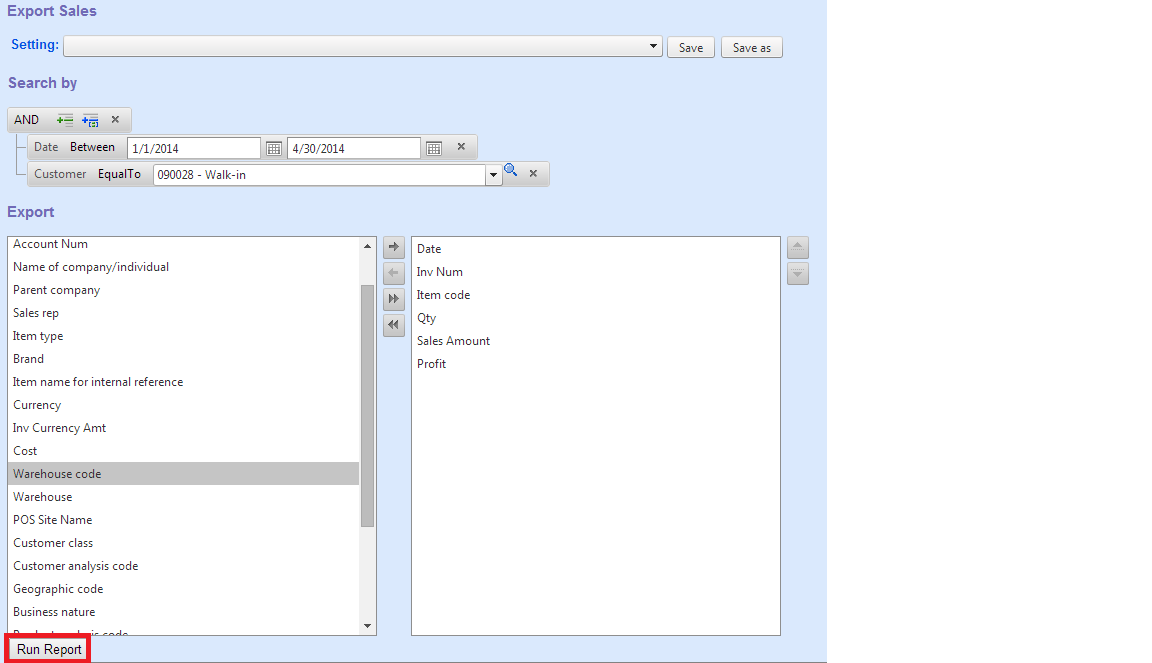
10. Click “Run Report” button.
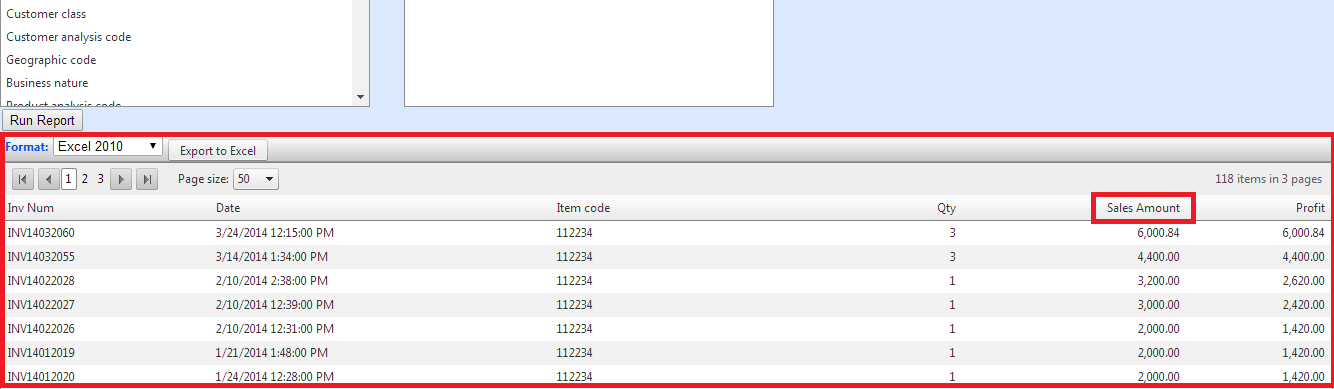
11. Next, to let the report display the data sorted by descending or ascending, click the column item. For example, you want to see the data from “Sales Amount” in descending order.
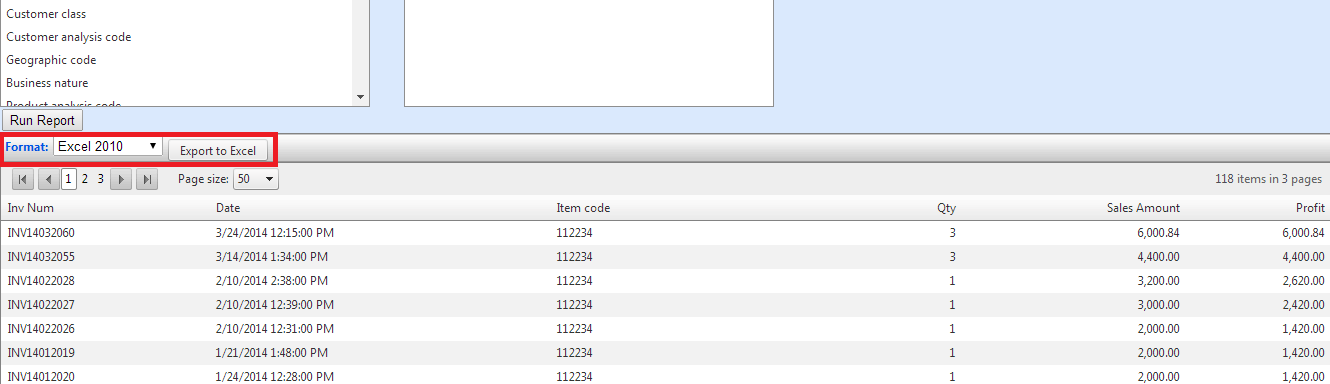
12. To export the report in excel format, click “Export to Excel”.
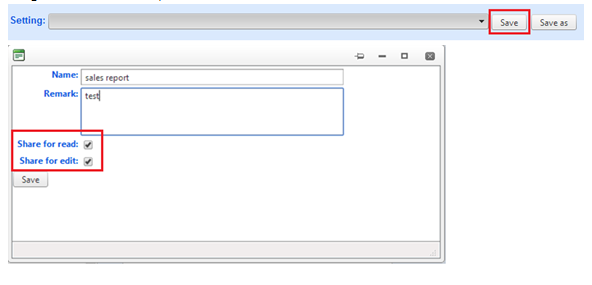
13. Finally, to save the report for review, click “Save” button, you can save as sharing for read and edit, or not share.